Example code of an initial spread simulation and control action
Here, we describe the population and events data used for dissemination and control actions. The datasets provided are a fair representation of the actual farm density ratio distribution of the farms, in the same way, movement events provided here are similar to real between-farm movement networks.
Backgroud
The infection starts at the farm node with ID= 123456 with a population of 100 animals. Here, the disease was first detected 14 days after the initial disease introduction (infection started with 40 infected animals).
Data Preparation
- Population data: total number of animals
population <- MHASpread::population # Get the population data example
population$I_bov_pop[population$node== "123456"] <- 40 # Infected 40 bovine in farm with id = '123456"
- Events data: between farm movements (in and/or out), birth or death
# Select the in and out farm dynamics (movements, births, deaths)
events <- MHASpread::events # Load the events database
Run the initial repeat without any control actions
In this simulation, we will consider different disease transmission parameters. Note: Please, consider that this model is stochastic, which means that several runs are required to get a proper description of the inputs to be simulated.
# Run the SEIR model to simulate disease spread without control measures
result <- disease_spread_sim(
  population =  population,              # Population database (contains list of farms)
  events = events,                       # Events database (e.g., contains list of movement events)
  simulation_name = "scenario_1_init",   # Simulation tag name (you can change to what you like)
  days_of_simulation = 30,               # Duration of simulation in days (for how many days the spread will run)
  initial_day_simulation=1,
  beta_swi_to_swi = c(min = 3.75, mode = 6.14, max = 10.06))   # is possible to customize the force of transmission as desired
Model output is used to update the population data that will be used to apply control actions
After running this part, we can visualize an epidemic curve for each species according to the number of days selected for silent dissemination.
Initial spread epidemic curves (farm-level)
Initial spread epidemic curves (animal-level)
- Plot infected animal distribution by species
plot_SEIR_animals(model_output = model_output, # Model output
                plot_suceptible_compartment = F, # FALSE to hide S animals
                by_host = T) # TRUE will plot all species together
See the geo-location of the farms
Creates an interactive map about the farm that has been infected overall simulation, in the background, the color bins represent the kernel density of the farm location weighted by the number of times in which the farm was infected. Thus, hots color highlights areas with farms that have been infected more times when compared with the others.
farms_location <-plot_nodes_kernel_map(model_output = model_output,
              population = population) # Save a map of farms that participated in this simulation

farms_location
Is possible to take a snapshot of the map by using the next line
mapview::mapshot(farms_location, file = "initial_outbreak_farms_location.png") # Save the map
How the control action simulations work
Control actions use the output of the initial spread. Control actions start in the next day post index case detection.
Explore control zones assuming detection of 100%
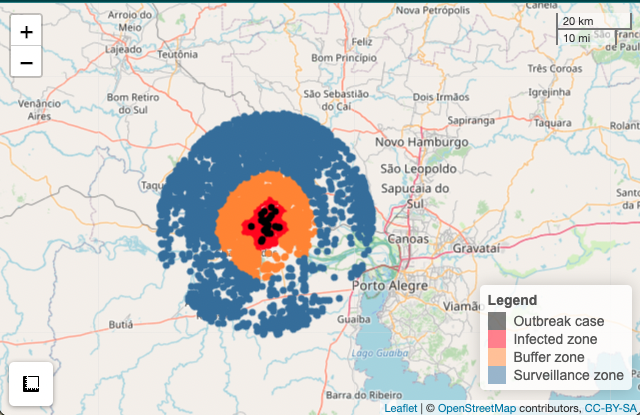
Here, all control actions are placed according to specific control areas zones: infected, buffer, and surveillance zones, respectively. Let’s check out an example of how these control zones look by selecting one of the previous simulation runs as an example of spatial distribution.
Control zones
detected_farms.id <- MHASpread::id_of_infectious_farms(model_output[[1]]$populationdb,
                     only_infected_comp = F) # FALSE will take all infection status

zones_arond_inft_farms <- assign_control_zones(
            population = population, # Population database
            infected_size = 3, # Size of the infected zone(s) in Km
            buffer_size = 7, # Size of the buffer zone(s) in Km
            surveillance_size = 15, # Size of the surveillance zone(s) in Km
            detected_farms.id = detected_farms.id,# Detected farms
            num_threads = 10) # Computer threads (don't overload your computer)

plot_farms_in_control_zones_areas(zones_arond_inft_farms, detected_farms.id) # Plot interactive map
This will produce an interactive map in the viewer tab like this:
Save a snapshot
mapview::mapshot(farms_location, file = "initial_outbreak_farms_location.png") # Save the map
Control actions
The next function has a bunch of arguments that control different control actions in the simulations to be performed. Then, the next paragraph will explain how to set those arguments argument by argument in the function:
##############################################################
##.            Simulate control action                 ------
##############################################################

# Setup for control actions ----
model_output = result  # Output of the SEIR model
break_sim_if = 100 # Threshold for terminating simulations if the number of infected farms exceeds this value
first_detectn_proportion = 0.1 # Proportion of initially detected infected farms

# Initial condition for control actions ----
days_of_control_action = 60  # Number of days for which control actions will be implemented

# Control zones setup ----
infected_size_cz = 3  # Size in kilometers of the infected zone
buffer_size_cz = 7  # Size in kilometers of the buffer zone
surveillance_size_cz = 15  # Size in kilometers of the surveillance zone

# Animal movement standstill setup ----
ban_length = 30  # Duration of animal movement standstill in days
infected_zone_mov = TRUE  # Indicator for applying the animal movement ban to the infected zone
buffer_zone_mov = TRUE  # Indicator for applying the animal movement ban to the buffer zone
surveillance_zone_mov = FALSE  # Indicator for applying the animal movement ban to the surveillance zone
direct_contacts_mov = TRUE  # Indicator for subjecting farms outside control zones with contact with positive farms to movement restrictions
traceback_length_mov = 1  # Number of steps to traceback in-going animal movements of infected farms

# Depopulation setup ----
limit_per_day_farms_dep = 1  # Limit of farms to be depopulated per day
depopulate_infected_zone = TRUE  # Indicator for applying depopulation in the infected area
depopulate_detected_farms = TRUE  # Indicator for only depopulating detected farms in the infected area

# Vaccination setup
days_to_get_inmunity = 15 # Number of days for full immunity (100% immune)
limit_per_day_farms_vac = 40 # Limit of farms to be vaccinated per day in the buffer area
limit_per_day_farms_infct_vac = 40  # Limit of farms to be vaccinated per day in the infected area
vacc_eff = 0.9 # Proportion indicating the effectiveness of the vaccine
vacc_bovine = TRUE # Indicator for vaccinating bovine population
vacc_swine = FALSE # Indicator for vaccinating swine population
vacc_small = FALSE # Indicator for vaccinating the small ruminant population
infected_zone_vac = TRUE # Indicator for applying vaccination to the infected zone
buffer_zone_vac = TRUE # Indicator for applying vaccination to the buffer zone
vacc_infectious_farms = TRUE # Indicator for applying vaccination to infectious farms
vacc_delay = 15 # Number of days for vaccine delay (e.g., time until animals received the first dose in the field)

# Run all control actions you defined
control_model = control_actions_sim(result,
                                    population,
                                    events,
                                    break_sim_if,
                                    days_of_control_action,
                                    infected_size_cz,
                                    buffer_size_cz,
                                    surveillance_size_cz,
                                    ban_length,
                                    infected_zone_mov,
                                    buffer_zone_mov,
                                    surveillance_zone_mov,
                                    direct_contacts_mov,
                                    traceback_length_mov,
                                    limit_per_day_farms_dep,
                                    depopulate_infected_zone,
                                    depopulate_detected_farms,
                                    limit_per_day_farms_vac,
                                    limit_per_day_farms_infct_vac,
                                    days_to_get_inmunity,
                                    vacc_eff,
                                    vacc_swine,
                                    vacc_bovine,
                                    vacc_small,
                                    infected_zone_vac,
                                    buffer_zone_vac,
                                    vacc_infectious_farms,
                                    vacc_delay,
                                    first_detectn_proportion)
Plot results
# Let's see the results of the control actions by farm types
plot_epi_curve_mean_and_cntrl_act(model_inital = result,
                                  model_control = control_model,
                                  control_action_start_day =  min(control_model[[2]]$population_by_day$day),
                                  plot_only_total_farms = FALSE)
Plot number of culled animals
plot_depopulation(control_output = control_model,
                 level_plot = "farms",
                 cost = 1000,
                 cumulative = T)
Plot the number of vaccinated animals
Let’s revisit each section of the control_actions function in more detail:
# Plot results of vaccinated farms
plot_vaccination(control_output = control_model,
                 population = population,
                 level_plot = "farms",
                 vaccine_bov = T,
                 vaccine_swi = F,
                 vaccine_small = F)